A bell curve describing the various crisis awareness and responses.

The Perception of Increased Crisis – Part 2

Are we witnessing increased national and worldwide crises, or are the algorithms dictating our world by manipulating our perceptions?

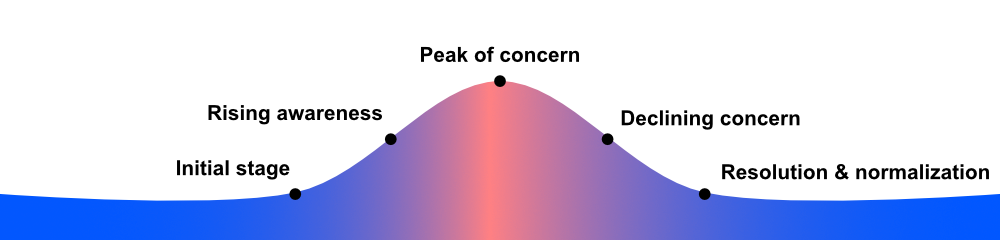
If you haven’t read “Predicting the Apocalypse: Societal Responses to Historic Threats – Part 1” I outlined what I called “The Crisis Response Bell Curve” as it related to four main tragedies:

  1. The influenza outbreak in the early 1900s
  2. The Great Depression of the late 1920s and 30s
  3. The Cold War of the 1950s through the 80s
  4. The Y2K panic of the late 1990s.

While the bell curve applies to events that happened after the start of the new millennium to the present day, technology has increased and decreased times along the curve. Changes in the major search engines, as well as the creation of social media and, most importantly, the application of algorithms and AI, changed how we perceive the world, including crisis events. First, let’s talk about the code that changed the world – algorithms.

Search engines and social media.

In today’s digitally dominated world, the role of algorithms in shaping our online experience is undeniable. Tracing the evolution of these algorithms, especially in search engines and social media, reveals a fascinating journey of technological advancement and its profound impact on information access and social interaction. This timeline and synopsis offer a detailed view into how these algorithms evolved, starting from the rudimentary keyword-based systems of the early 1990s to the highly sophisticated, AI-driven technologies we see today. Understanding this progression not only sheds light on the technical milestones achieved but also helps us comprehend the broader implications these algorithms have on our daily lives and societal norms. Let’s delve into this remarkable journey, examining the pivotal moments and key developments that have shaped the digital landscape as we know it.

The timeline and synopsis of the use of algorithms in search engines and social media can be outlined as follows:

1. Early Development of Search Engines (the 1990s)

  • Early 1990s: The first search engines, like Archie, Veronica, and Jughead, were basic tools for indexing and retrieving file names. They did not use sophisticated algorithms as we know them today.
  • The mid-1990s: Web search engines like AltaVista and Yahoo! emerged. They primarily used keyword matching and basic algorithms for ranking results.

2. Google’s Rise and Algorithm Evolution (Late 1990s – 2000s)

  • 1998: Google’s launch marked a significant advancement in search algorithms. Google’s PageRank algorithm used the number and quality of links to determine the importance of web pages.
  • 2000s: Google continued to refine its algorithms, introducing updates like Florida, Panda, and Penguin, which focused on eliminating low-quality content and spam from search results.

3. Social Media Algorithms (2000s – 2010s)

  • Early 2000s: Social media platforms like MySpace and LinkedIn used basic algorithms for user connections and content display.
  • 2006-2009: Facebook and Twitter started implementing algorithms to manage the increasing volume of content. These algorithms prioritized content based on factors like user connections, interactions, and engagement.

4. Advanced Algorithm Integration (2010s – Present)

  • 2010s: Both search engines and social media platforms started using more sophisticated algorithms. For search engines, this meant better semantic search capabilities (understanding user intent), while social media algorithms evolved to include personalized content feeds based on user behavior.
  • Mid-2010s: Introduction of machine learning and AI in algorithms. Google’s RankBrain and Facebook’s DeepText are examples of AI integration for better understanding user queries and content.

5. Recent Trends and Ethical Considerations (2020s)

  • 2020s: The focus shifted towards ethical implications, like privacy concerns and algorithmic bias. There’s an ongoing effort to make algorithms more transparent and fair.
  • Present: Continuous refinement of algorithms for better accuracy, user experience, and ethical considerations is ongoing.

This timeline shows a general progression from basic keyword-based algorithms to sophisticated, AI-driven systems that understand user intent and preferences, with ongoing efforts to address ethical concerns.

Crisis events after Y2K:  Examining four events from 2006 to 2009.

While there were numerous events that occurred from the start of the millennium to the writing of this article, I would like to focus on four and give a brief synopsis of each one. The point of the time is to coincide with the first algorithmic changes and how they (the algorithms) affected the crisis response bell curve.

Global Financial Crisis (2007-2008):

This was a severe worldwide economic crisis considered by many economists to have been the most serious financial crisis since the Great Depression of the 1930s. It resulted in the threat of total collapse of large financial institutions, the bailout of banks by national governments, and downturns in stock markets around the world. The housing market also suffered, resulting in evictions, foreclosures, and prolonged unemployment.

H1N1 Influenza Pandemic (2009):

The H1N1 pandemic, also known as the swine flu pandemic, was a global outbreak of a new strain of H1N1 influenza virus. First identified in Mexico in April 2009, it spread rapidly worldwide. The World Health Organization (WHO) declared it a pandemic in June 2009. It was a significant health crisis, with millions infected and thousands of deaths globally. The response included widespread vaccination campaigns and public health measures.

Rising Concerns About Climate Change and Environmental Degradation:

This period saw heightened awareness and concern about climate change and environmental issues. The release of the Fourth Assessment Report of the Intergovernmental Panel on Climate Change (IPCC) in 2007, which highlighted the human influence on climate change, was a significant moment in this regard. This led to increased activism, international discussions, and policies focused on environmental sustainability.

2008 Mumbai Attacks:

A series of terrorist attacks took place in November 2008, when ten members of an Islamist militant organization based in Pakistan carried out 12 coordinated shooting and bombing attacks lasting four days across Mumbai. The attacks, which drew widespread global condemnation, led to significant changes in Indian and global counterterrorism strategies and policies.

Changes in the “Crisis Response Bell Curve.”

The evolution of news sources and the introduction of algorithms in search engines and social media from 2001 to 2007 had a significant impact on the public’s progression through the “Crisis Response Bell Curve.” This change in the media landscape affected both the speed and the nature of public response to crises. Here’s how these factors likely influenced the timeline of the bell curve:

Increased Speed of Information Dissemination:

  • The rise of digital news platforms and social media led to much faster dissemination of information. News about a crisis could spread globally within minutes, potentially accelerating the movement from initial awareness to peak concern.

Greater Accessibility to Information:

  • With the advent of smartphones and more sophisticated internet technologies, people had unprecedented access to real-time updates, leading to quicker public reactions.

Enhanced Personalization and Echo Chambers:

  • Algorithms began tailoring news feeds and search results to individual preferences, potentially reinforcing preexisting beliefs and biases. This could lead to intensified reactions among certain groups, although it might not uniformly speed up the progression through the bell curve for all demographics.

Overload of Information and Misinformation:

  • The abundance of sources and the rapid circulation of both accurate and inaccurate information could lead to confusion, anxiety, and “information overload.” This might have accelerated the initial stages of the bell curve but also prolonged the resolution phase, as sorting through conflicting information can delay a collective sense of resolution.

Increased Public Engagement and Mobilization:

  • Social media allowed for more rapid and widespread public engagement, enabling quicker organization of responses, whether it be public health measures, financial interventions, or climate change actions.

The changes in the media landscape from 2001 to 2007 likely decreased the time it took for the public to move from initial awareness to peak concern. However, these changes could also have complicated the resolution phase, as the sheer volume of information and the prevalence of misinformation might make it harder for the public to collectively understand that a crisis has been resolved or mitigated. Additionally, the effect on the bell curve’s timeline would vary depending on the nature of the crisis and the specific ways information about it was communicated and received.

From the 2010s to the early 2020s.

The advanced algorithm integration in the 2010s, particularly with the introduction of machine learning and AI into search engines and social media platforms, would have a significant impact on the timing and dynamics at various points in the “Crisis Response Bell Curve.” Here’s an analysis of how these changes might affect different stages of the curve given the advancement of algorithms and the introduction of AI:

Initial Awareness:

  • Increased Speed: The improved ability of algorithms to understand user intent and to personalize content means that information about a crisis could reach relevant audiences faster than ever before. This would likely lead to a quicker initial awareness among the public.
  • Targeted Reach: AI-driven algorithms could more effectively identify and target users who might be interested in or affected by a particular crisis, further speeding up the awareness phase.

Rising Awareness and Concern:

  • Amplified Concern: Personalized feeds and sophisticated content recommendation systems could lead to a rapid escalation in concern as users are continuously exposed to content related to the crisis.
  • Echo Chambers: Algorithmically created echo chambers might intensify perceptions and fears about the crisis, potentially leading to a steeper and faster rise in the bell curve.

Peak of Concern:

  • Rapid Peak Formation: Due to the efficient spread and reinforcement of information (and sometimes misinformation), the peak of concern could be reached more quickly.
  • Polarization and Intensity: AI-enhanced algorithms might contribute to more polarized and intense reactions at the peak, as they often prioritize content that engages users, which can be content that provokes strong emotional reactions.

Declining Concern:

  • Information Saturation: The decline in concern might be slower due to the continued circulation of crisis-related content, even as the actual threat diminishes.
  • Misinformation Persistence: The persistence of misinformation or outdated information in search results and feeds could delay the resolution of concerns.

Resolution and Normalization:

  • Prolonged Resolution Phase: The resolution phase might be extended due to the challenges in disseminating updated, accurate information that counteracts earlier fears or misconceptions.
  • Need for Authoritative Sources: The role of authoritative sources becomes crucial in this phase to provide clear and accurate information to help move towards resolution.

While advanced algorithms in the 2010s up to the present made it faster to become aware of and respond to crises, they also introduced complexities that could prolong the later stages of the “Crisis Response Bell Curve.” The personalization and echo chamber effects of these algorithms can amplify fears and make it harder to reach a collective understanding of when a crisis has been resolved or its impact mitigated.

My personal conclusions:

The frequency of crisis events from 2006 to the present that could be considered on par with significant historical events like the early 1900s influenza outbreak, the Great Depression, the Cold War, and the Y2K panic has not necessarily increased in a simple quantitative sense. However, the nature of crises and global interconnectedness have led to a perception of increased frequency and intensity. Here are some key points to consider:

Globalization and Interconnectedness:

The world has become more interconnected due to globalization and advances in technology. This means that a crisis in one part of the world can have immediate and significant impacts globally, making events feel more frequent and urgent.

Media and Information Proliferation:

With the advent of digital media and the internet, people are now more informed about global events than in any previous era. This constant flow of information can create a perception of an increase in the frequency of crisis events.

Diverse Types of Crises:

Modern times have seen a variety of crises, including financial meltdowns (like the 2008 financial crisis), pandemics (like COVID-19), climate change-related disasters, and geopolitical conflicts. While not all are on the scale of the events listed, they contribute to a sense of a world in frequent turmoil.

Rapid Technological Change and Cybersecurity Threats:

The digital era has brought new types of crises, including significant concerns over cybersecurity, data privacy, and the potential for digital infrastructure failures, somewhat analogous to the Y2K panic but more frequent and varied.

In summary, while it might not be accurate to say that the frequency of crises on the scale of the significant historical events listed has dramatically increased since 2006, the nature of modern crises, combined with global interconnectedness and the rapid dissemination of information, has led to a heightened perception of frequent and intense crises.


Print Friendly, PDF & Email